
Research charts and helpers
After Load data into Rust succeeds, research cells can use these helpers. They are notebook helpers supplied by AQS, not additional AQE strategy APIs. After upgrading AQS, load data again to install the new helpers in an existing session.
Data available to cells
Section titled “Data available to cells”data is an AqsData collection keyed by the loaded symbols. It wraps a HashMap<String, DataFrame> and still supports indexing (data["BTCUSD"]), get, insert and other map methods through dereferencing. It is not a type alias for HashMap. bars remains a working copy of the first loaded symbol. Historical timestamps are UTC Unix milliseconds in an Int64 column named timestamp.
data.symbols() // Sorted symbol namesdata.summary()?; // Table of symbols, row counts and columnslet mut btc = data.bars("BTCUSD")?;let mut eth = data.bars("ETHUSD")?;Use exact provider symbols (for example Yahoo’s BTC-USD). A missing symbol produces an error listing available symbols. Each bars call returns an independent Polars working copy: calculating indicators on btc does not alter data or eth. Equivalent free functions are aqs_symbols(&data) and aqs_bars(&data, "BTCUSD")?.
The session panel’s Loaded symbols selector can add a ready-made table/candlestick cell for one symbol. It inserts code without executing it.
Table previews
Section titled “Table previews”aqs_table(&bars, 10)?;aqs_table(frame: &DataFrame, limit: usize) returns Result<(), Box<dyn std::error::Error>>. It emits column names and formatted values without modifying the DataFrame.
The helper includes at most 100 rows. The viewer displays at most 50 columns. Preview limits do not truncate the DataFrame available for analysis.
Simple lines and overlays
Section titled “Simple lines and overlays”aqs_plot(&bars, "close")?;aqs_plot_many(&bars, &["close", "EMA_20", "EMA_50"])?;aqs_plot(frame: &DataFrame, column: &str) returns Result<(), Box<dyn std::error::Error>>. The selected column must cast to Float64; timestamp must be Int64 milliseconds. Missing columns or incompatible types produce a cell error.
Each call creates one chart; aqs_plot_many puts several lines on the same price axis. The named columns must already exist. Tables and charts can be emitted from the same cell, in call order:
aqs_table(&bars, 5)?;aqs_plot(&bars, "close")?;Candles, moving averages and synchronized panes
Section titled “Candles, moving averages and synchronized panes”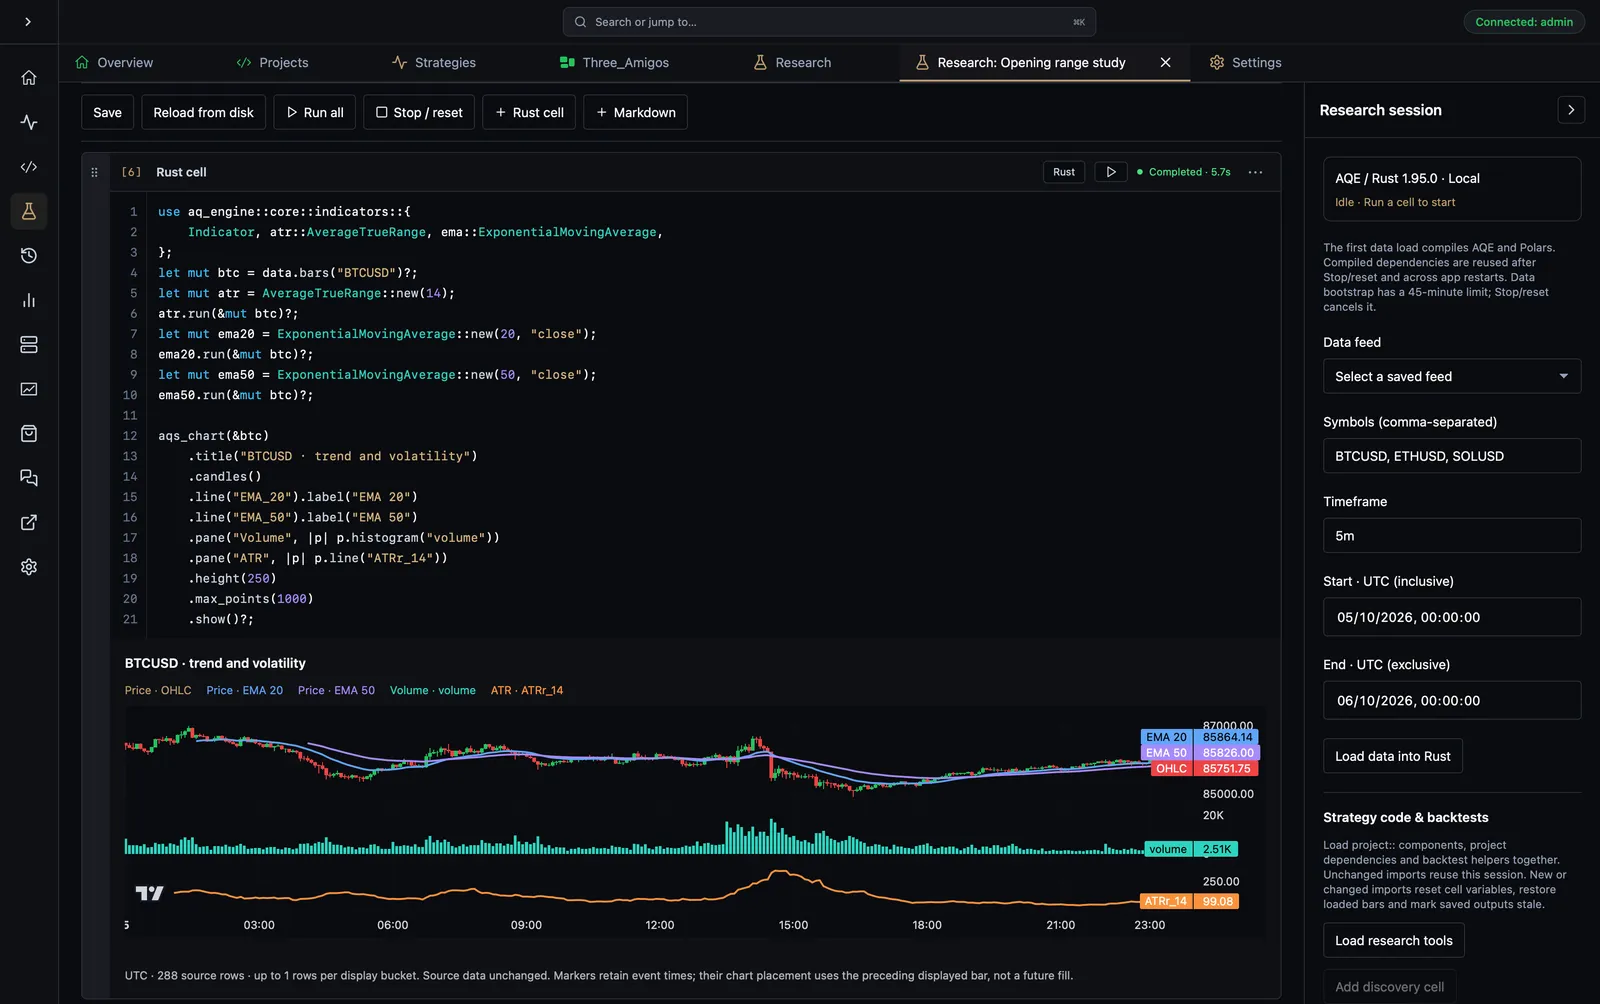
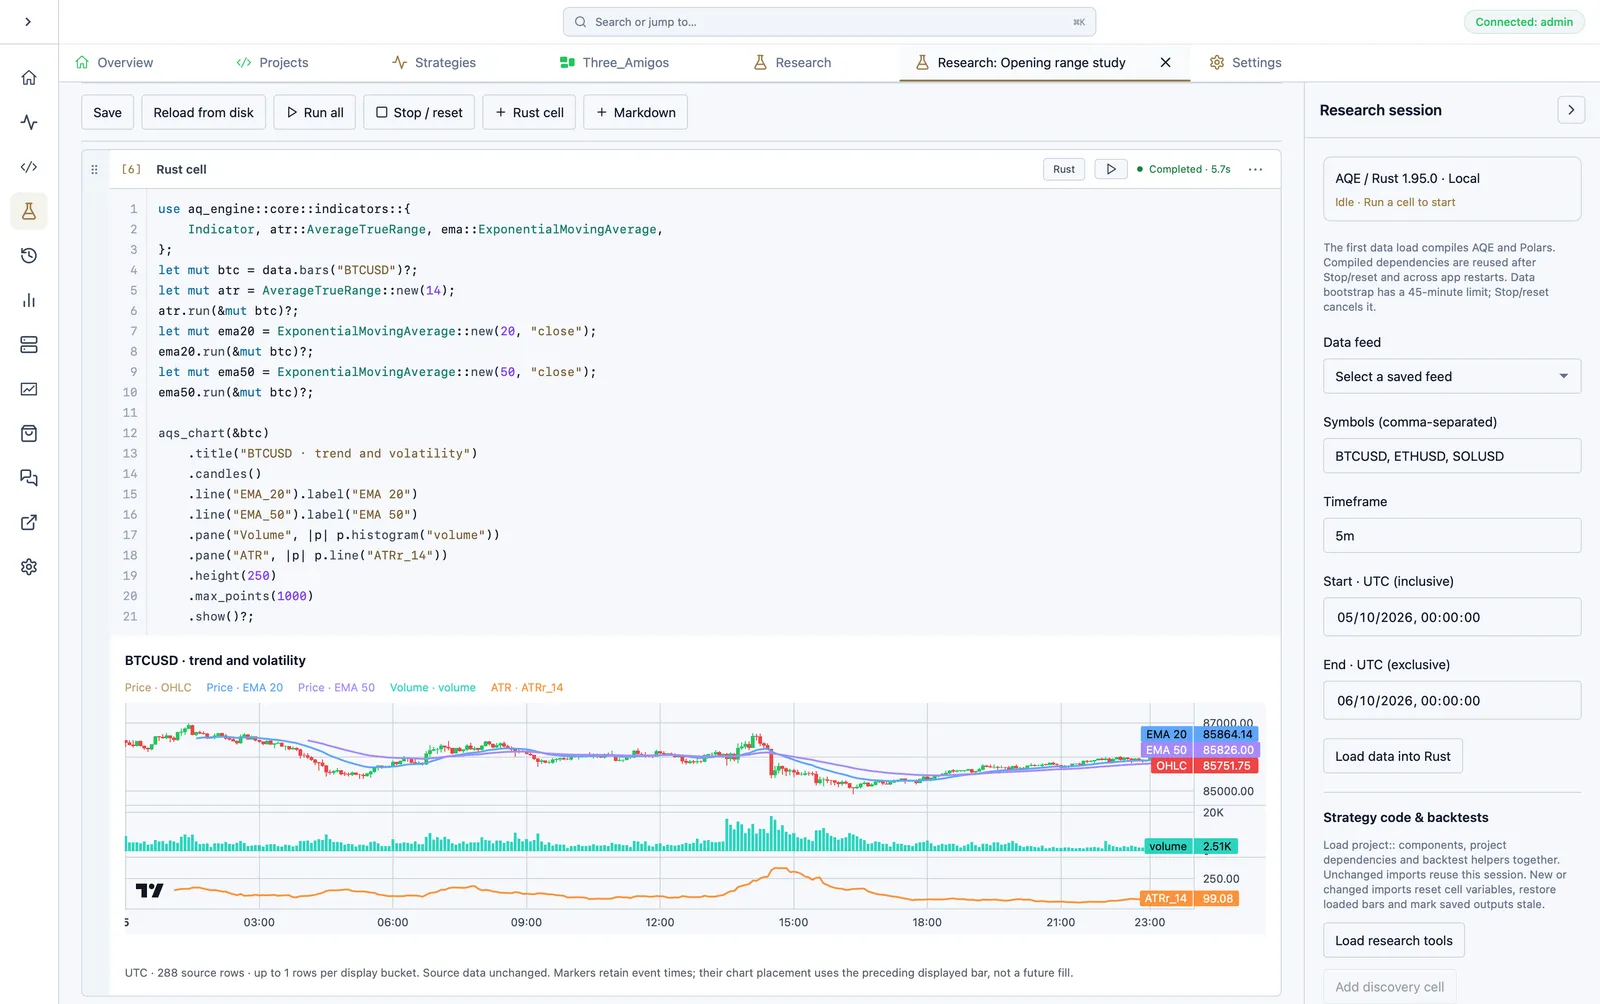
Research chart configuration and its output: BTCUSD candles with two moving-average overlays, a volume histogram and an ATR line in synchronised panes. View the full-size screenshotView the full-size screenshot.
use aq_engine::core::indicators::{    Indicator, atr::AverageTrueRange, ema::ExponentialMovingAverage,};let mut btc = data.bars("BTCUSD")?;let mut atr = AverageTrueRange::new(14);atr.run(&mut btc)?;let mut ema20 = ExponentialMovingAverage::new(20, "close");ema20.run(&mut btc)?;let mut ema50 = ExponentialMovingAverage::new(50, "close");ema50.run(&mut btc)?;
aqs_chart(&btc)    .title("BTCUSD · trend and volatility")    .candles()    .line("EMA_20").label("EMA 20")    .line("EMA_50").label("EMA 50")    .pane("Volume", |p| p.histogram("volume"))    .pane("ATR", |p| p.line("ATRr_14"))    .height(650)    .max_points(1000)    .show()?;
AQE indicators operate on normal Polars DataFrames. Load enough history for the longest period and its warmup. The chart builder only plots columns; it does not calculate an indicator just because its name is passed to line. A column with no finite values produces a cell error.
The main chart and pane builders support .line(column), .area(column), .histogram(column), .candles() and .ohlc(). .label(text) renames the last series in that builder. Candles and OHLC bars require open, high, low and close columns. All time series require timestamp.
Notebook time charts support zoom/pan, a shared time axis, hover readouts, automatic series colours and resizable pane dividers. Every pane has its own vertical scale; overlays in one pane share that scale. Put different units, such as price and volume, into different panes. .height(pixels) is bounded to 240–1200; the default grows with pane count. Up to six panes and twelve total series are supported.
Preview sampling and data integrity
Section titled “Preview sampling and data integrity”The chart sorts its view by timestamp and converts milliseconds to seconds. When multiple rows map to the same second, the last source row wins consistently across overlays. Null or out-of-range timestamps are omitted. Null/non-finite values are omitted, including indicator warmup. Gaps are not filled with new observations; line rendering can visually connect the remaining points.
Large time charts use common row buckets across all panes. A candle uses the first valid open, highest high, lowest low and last valid close in its bucket. Histograms sum their bucket; lines and areas use the last finite value. Each bucket is positioned at its final timestamp. This is display aggregation only: the source DataFrame, research calculations and backtests are unchanged. Invalid OHLC bounds or overflow produce an error.
.max_points(n) accepts 2–2000 (default 1000) as a per-series target. The helper reduces that target as needed to keep total output under 4000 points and 240 KiB. The caption reports source row count and bucket size. Use a narrower date range when inspecting individual bars.
Scatter plots and distributions
Section titled “Scatter plots and distributions”aqs_scatter(&btc, "volume", "ATRr_14")?;aqs_histogram(&btc, "ATRr_14", 30)?;aqs_scatter(frame, x_column, y_column) pairs values from the same source row. It removes pairs containing missing/non-finite values and samples at most 2000 pairs for display.
aqs_histogram(frame, column, bins) counts all finite observations into 2–100 numeric bins. A constant column becomes one bin. Missing/non-finite observations are counted in the caption as omitted. This is a distribution, unlike the chart builder’s .histogram("volume"), which draws values against time.
These two chart types use numeric axes and SVG tooltips, not the time-chart zoom/pan controls. They require no timestamp column.
Compare symbols on a common basis
Section titled “Compare symbols on a common basis”aqs_compare(&data, &["BTCUSD", "ETHUSD", "SOLUSD"], "close")?;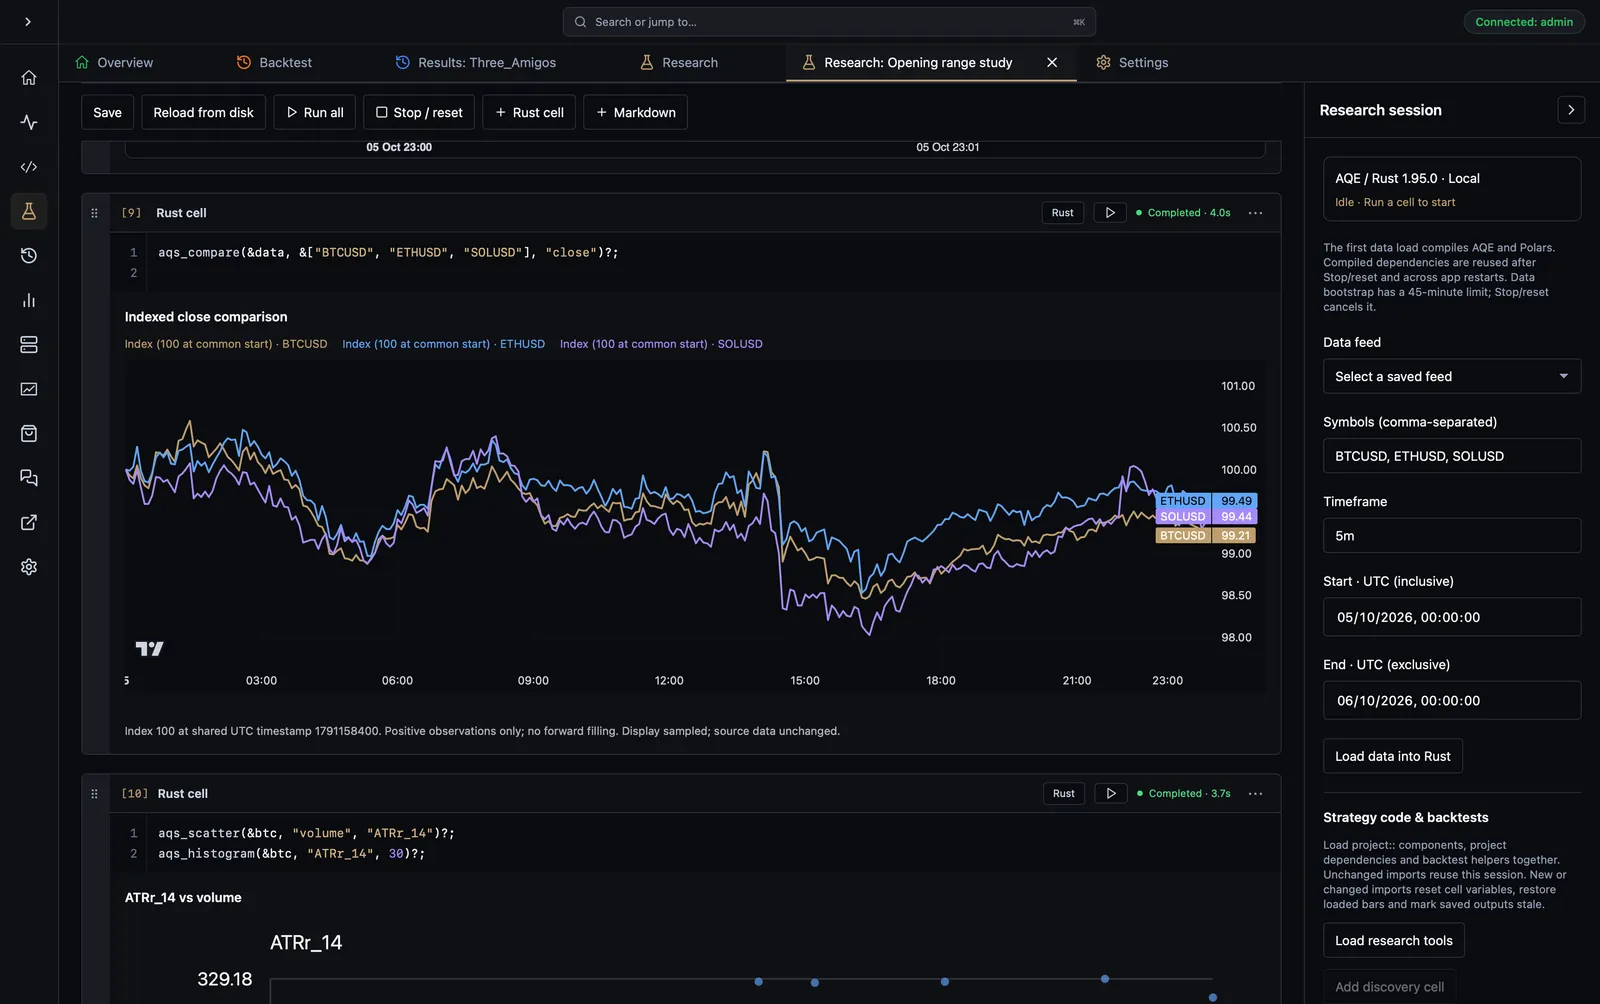
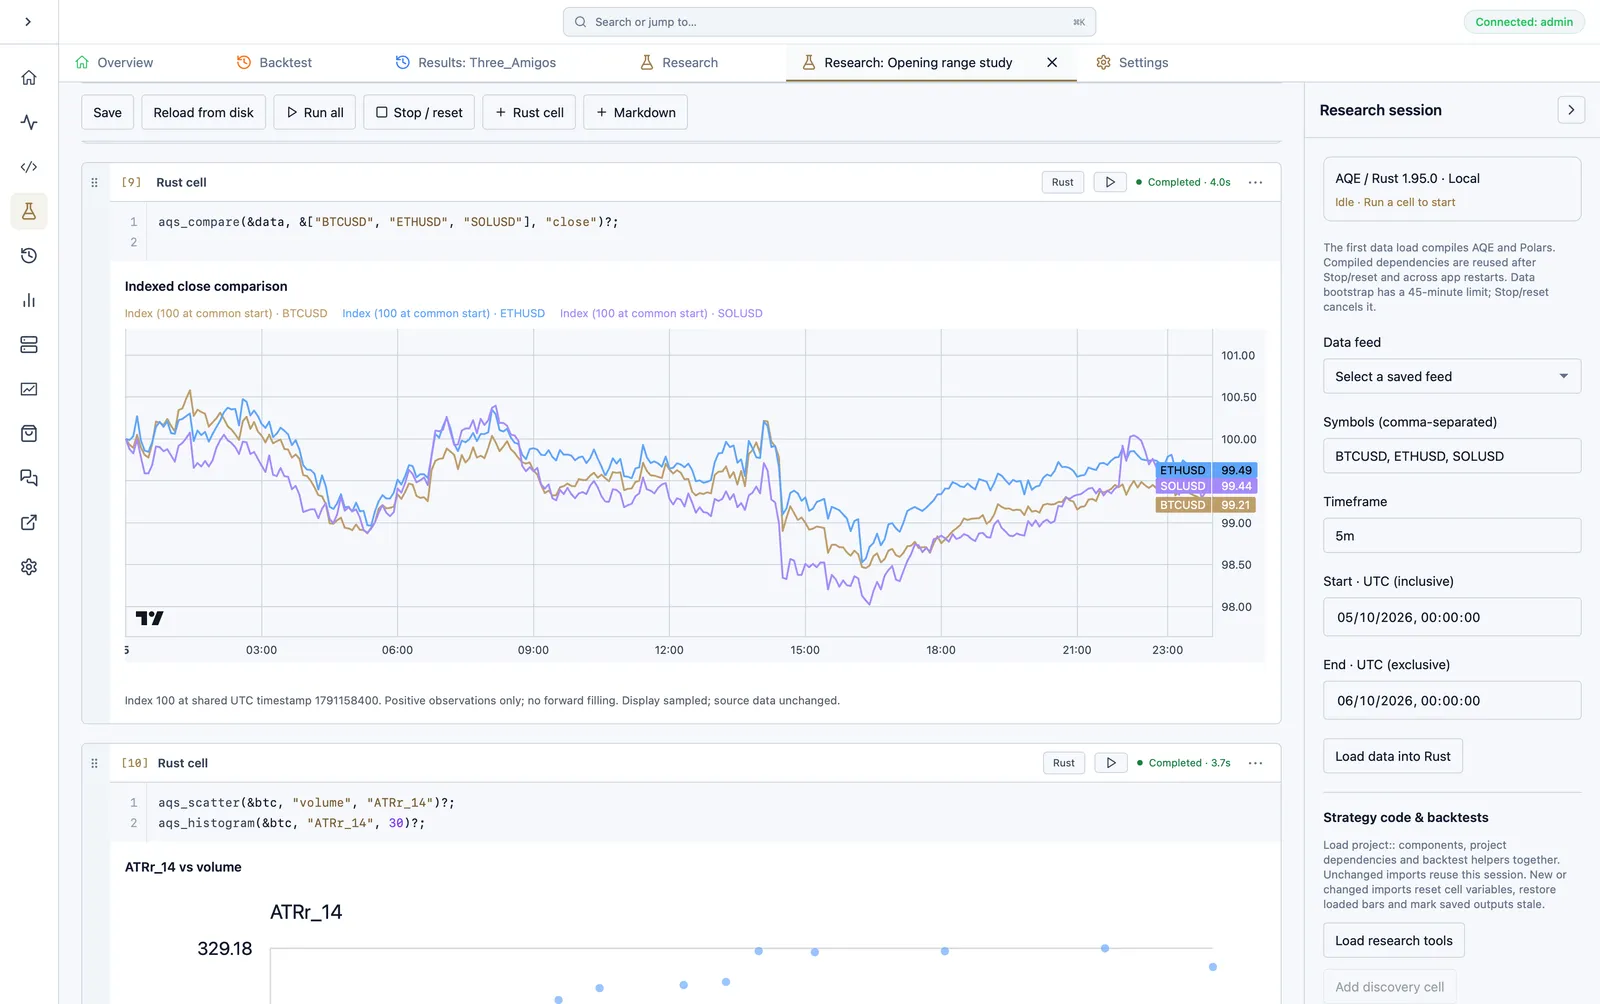
Compare BTCUSD, ETHUSD and SOLUSD closing prices from a shared index-100 starting point. The lines show relative price changes, not strategy returns. View the full-size comparison screenshotView the full-size comparison screenshot.
Choose 2–8 distinct loaded symbols. Each line starts at index 100 at the first exact timestamp shared by all symbols with finite, positive values. Later missing timestamps are not forward-filled; each series retains its own observations. With no common anchor, the helper returns an error. The display samples each series to roughly 400 points, keeping its first and last observations.
This is a normalized price comparison, not a strategy equity curve, portfolio return or correlation calculation. It does not adjust instruments for costs, corporate actions or currencies. Use appropriate adjusted input data for your study.
Custom structured output
Section titled “Custom structured output”aqs_emit(value: serde_json::Value) emits one structured preview. Prefer the helpers above for charts. The viewer also retains legacy table and line support:
aqs_emit(serde_json::json!({    "kind": "table",    "columns": ["Metric", "Value"],    "rows": [["Observations", bars.height().to_string().as_str()]],    "totalRows": 1}));
aqs_emit(serde_json::json!({    "kind": "line",    "label": "Example series",    "points": [        {"time": 1791241200, "value": 1.0},        {"time": 1791241260, "value": 1.2}    ]}));
Custom line timestamps are Unix seconds, unlike the DataFrame’s milliseconds. Table columns and cell values should be strings. New helpers emit version-1 chart, scatter, distribution and heatmap specifications. To inspect a builder payload without displaying it, use .build()? instead of .show()?. Notebook-supplied HTML is not rendered.
Signal overlays and heatmaps
Section titled “Signal overlays and heatmaps”Use .signals(&signals)? on aqs_chart to overlay generated signals or entry fills. Custom signal frames need UTC-millisecond timestamp, side (Buy or Sell) and optionally label.
aqs_chart(&btc).candles().signals(&signals)?.show()?;aqs_heatmap(&monthly, "month", "year", "return_pct")?;Heatmaps accept up to 50 labels per axis and 2,500 cells. Missing values stay blank, not zero. Duplicate coordinates produce an error: aggregate explicitly before plotting. Colours are centred on zero. Signal markers and heatmaps are preserved in static AQI paper snapshots as well as the local notebook.
For saved backtest readers, equity/drawdown comparisons, aqs_returns_heatmap, alpha replays and isolated graph experiments, see Strategy reuse and backtests.
Output limits and errors
Section titled “Output limits and errors”The notebook’s AQI paper section opens the full paper editor with a notebook component block containing code and eligible saved output samples. Use Add notebook in the paper editor to select specific cells or exclude outputs. Insertion is local; review and save or publish explicitly. Time-series paper charts use the same TradingView Lightweight Charts renderer as the research notebook, including overlays, synchronized panes, signal markers and UTC crosshair values. Readers can zoom and pan saved samples; these charts do not load live data. Heatmaps, scatter plots and distributions use the research SVG renderer, and static fallbacks remain available without JavaScript. Stale, failed or unverified results are excluded. The snapshot does not embed raw datasets or execute on the reader’s machine. See sharing research for the review and publishing workflow.
The runtime bounds text and individual rich previews to 256 KiB. Large output should be reduced or written to a project-local file. The viewer allows up to 20 rich previews per evaluation.
Compiler and runtime diagnostics appear below the relevant cell; stderr also stops Run all for review. Output stays in the saved notebook and is marked stale after edits or a reset. These previews are separate from the live AQS chart workspace.
We use essential cookies and storage for sign-in, account security, colour theme preferences, this notice, and required PostHog internal usage, session quality, and reliability metrics. We do not use advertising cookies.